Zero on logarithmic scale with Gnuplot
When plotted properly, the zero value would be at $\log(0) = -\infty$ on the respective axis, which is not very practical on finite screens. On the other hand, logarithmic scale is a good way how to represent values spanning multiple orders of magnitude and there are situations where the zero value is valid.
set format x '%.0b%B'
set logscale x
# define clamping value and create a tick
xzero=1024
set xtics 4*xzero,4
set xtics add ("0" xzero)
set format y '%.0b%B'
set logscale y
yzero=512
set ytics 4*yzero,4
set ytics add ("0" yzero)
# apply clamping to values
zx(x) = (x < xzero) ? xzero : x;
zy(y) = (y < yzero) ? yzero : y;
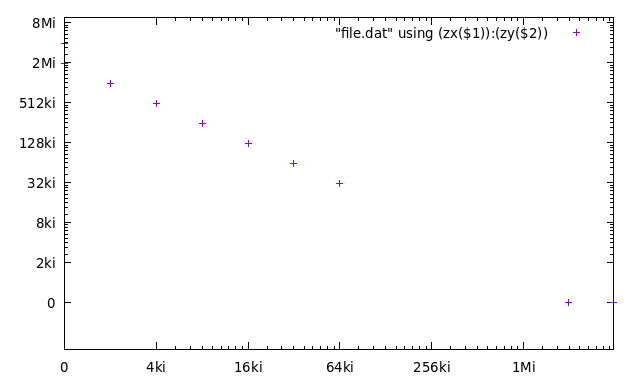
plot "file.dat" using (zx($1)):(zy($2))
pause(-1)This also shows how to use binary prefix format (such as Ki, Mi,…).
TODO Learn how to implement this with set nonlinear x via f(x) inverse F(x).